Economic Indicators of the College Station-Bryan MSA
March 2024 Edition
"Economic Indicators of the College Station-Bryan MSA" and the College Station-Bryan Business-Cycle Index contained within are products of the Texas A&M Private Enterprise Research Center. "Economic Indicators" is sponsored by the Brazos Valley Economic Development Corporation.
Highlights
•The Business-Cycle Index increased 0.2% from December 2023 to January 2024.
•The local unemployment rate for January 2024 was 3.1% in January 2024, unchanged from December 2023.
•In the March data release, January’s local nonfarm employment decreased by 0.3% from December 2023.
•Inflation-adjusted taxable sales were up by almost 1% from December 2023 to January 2024.
•Inflation-adjusted quarterly wages were down by 1.6% in the third quarter of 2023 compared to the previous quarter.
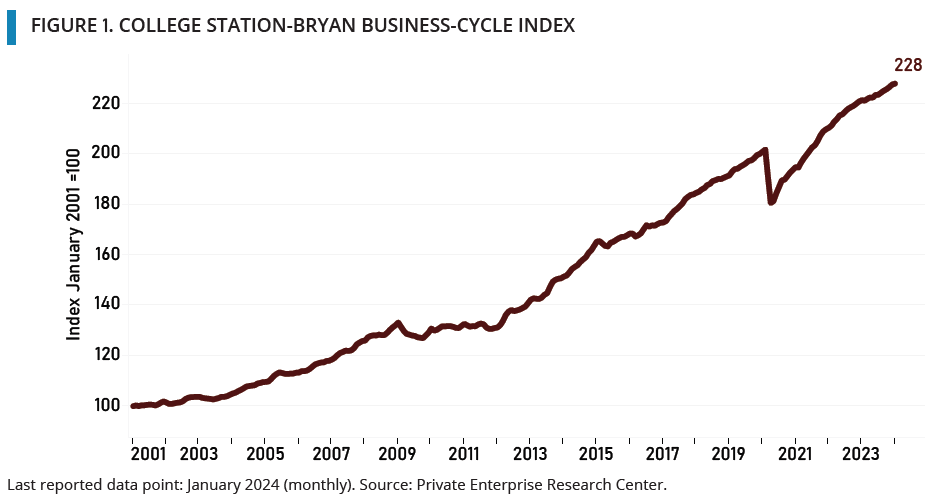
The College Station-Bryan Business-Cycle Index
The Business-Cycle Index increased to 228 in January 2024, an increase of 0.2% from its December 2023 value. The slight increase in the graph is a result of an unchanged unemployment rate, an increase in inflation-adjusted taxable sales, and despite a decrease in nonfarm employment. Quarterly total wages were updated this month, and the most recent value (for the third quarter of 2023) was down 1.6% from the previous quarter.
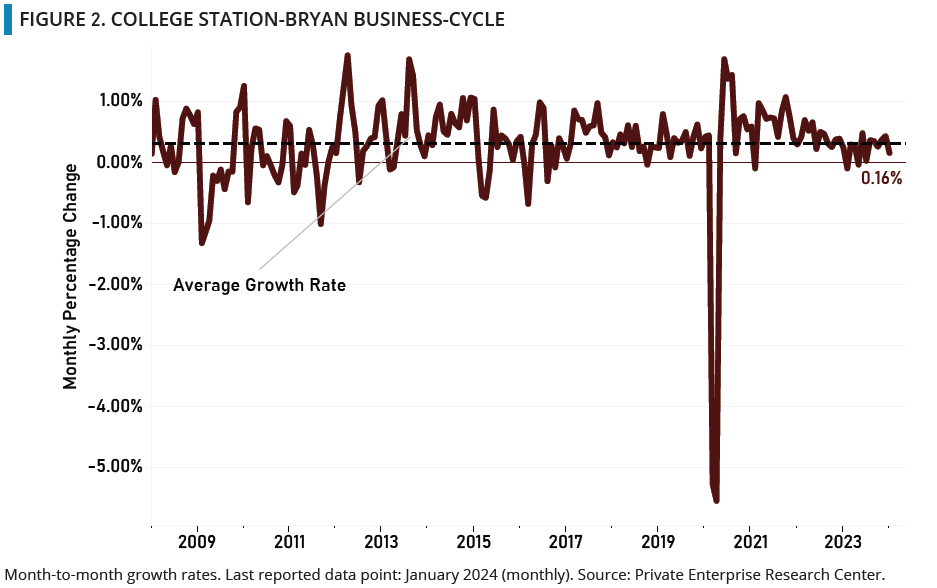
The College Station-Bryan Business-Cycle
The 0.2% increase in the CSB Business-Cycle from December 2023 to January 2024 is shown in Figure 2. The local unemployment rate remained unchanged at 3.1% in January from December 2023. The revised nonfarm employment series decreased by 362 workers from 140,921 in December 2023 to 140,559 in January 2024. The third monthly variable, inflation-adjusted taxable sales, increased by 1% between December and January. The fourth variable used to estimate in the business cycle, quarterly inflation-adjusted total wages, was updated this month. Third quarter 2023 wages showed a 1.6% decrease in inflation-adjusted quarterly wages from the previous quarter and a decrease of 1.7% from the previous year.
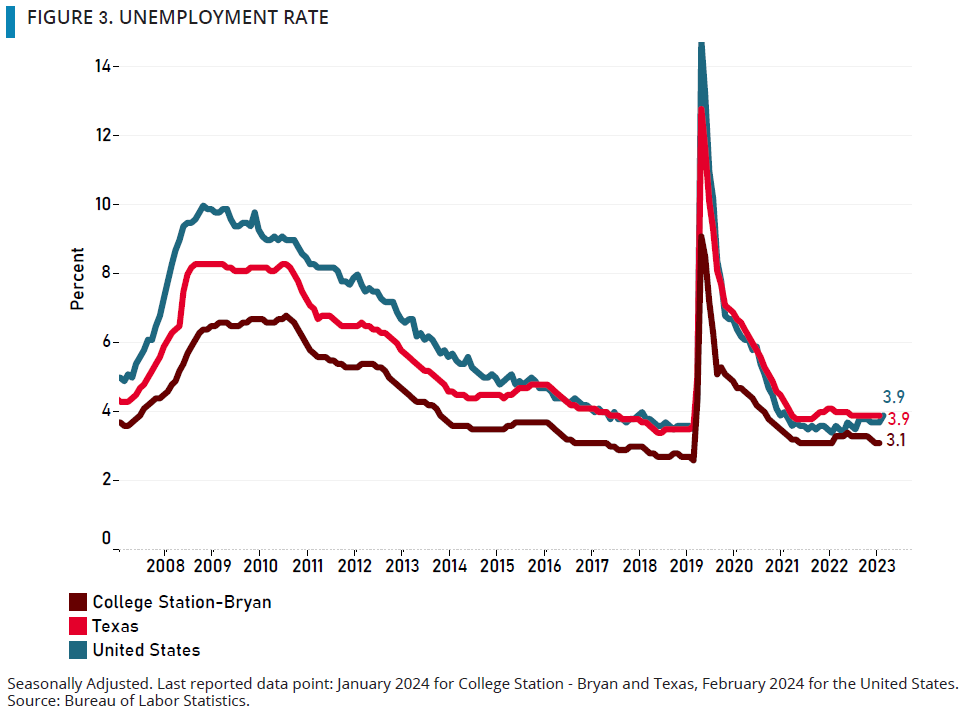
Unemployment Rate
Figure 3 shows the unemployment rates for College Station-Bryan and for Texas from January 008 to January 2024, and for the nation as a whole through February 2024. The unemployment rate in College Station-Bryan remained the same at 3.1% in January compared to December 2023. The Texas rate also remained the same at 3.9% in January compared to December. At the national level, the unemployment rate was 3.7% in January, but increased to 3.9% in February. The state and metropolitan area unemployment rates for February will be released by the Bureau of Labor Statistics on March 22 and April 3, 2024, respectively.
It is important to keep in mind that a national unemployment rate of 3.9% is considered to be low, both historically and by estimates of what rate is consistent with a non-recessionary economy. For instance, the U.S. Congressional Budget Office’s (CBO) ‘Noncyclical Rate of Unemployment’ for 2023 and 2024 is 4.4%. The Federal Reserve System’s Summary of Economic Projections has the unemployment rate at 4.1% by the end of 2024 and has the long-run (beyond 2026) unemployment rate also at 4.1%. Using either the CBO or the Federal Reserve numbers as a benchmark, the current 3.9% national rate of unemployment is still indicating a labor market in the expansionary phase of the business cycle.
Focus on the College Station-Bryan MSA
This month we present the unemployment rates in the Texas Metropolitan Statistical Areas (MSAs) for the month of January. We also present the revision of the local area’s nonfarm employment series and track the long-run movements of nonfarm employment and local real taxable sales. Lastly, we discuss local and national air travel.
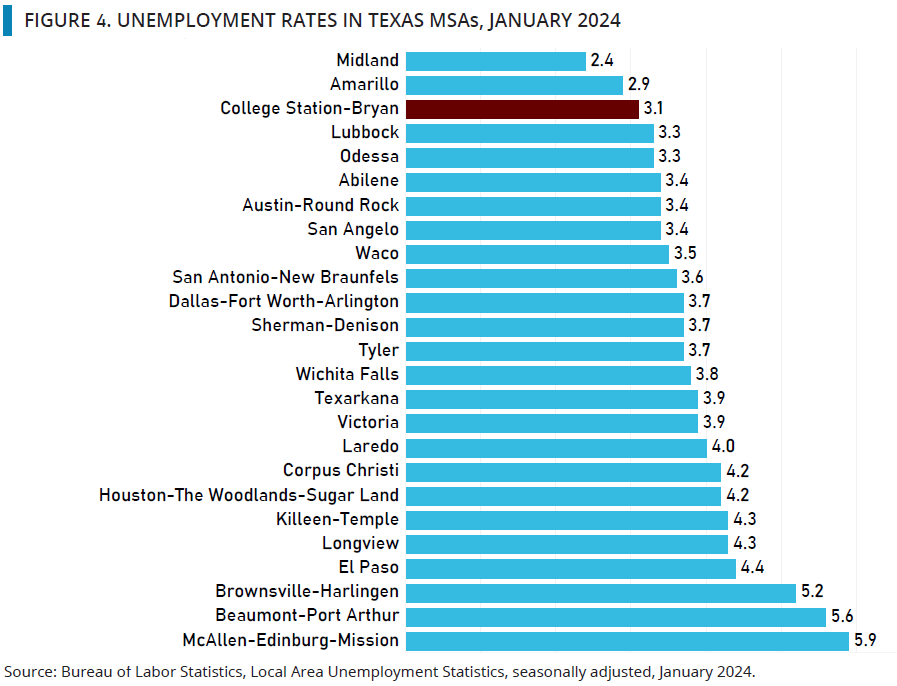
Texas MSA Unemployment Rates
Figure 4 depicts the local unemployment rates for all Texas MSAs for January 2024. College Station-Bryan’s rate of 3.1% was the third lowest, behind the 2.4% rate of Midland and 2.9% of Amarillo. At the other extreme, McAllen-Edinburg-Mission, Beaumont-Port Arthur, and Brownsville-Harlingen had the three highest unemployment rates at 5.9%, 5.6%, and 5.2%, respectively. Austin-Round Rock at 3.4% had the lowest unemployment rate among the four largest MSAs, while San Antonio-New Braunfels’ rate was 3.6%, Dallas-Fort Worth-Arlington’s rate was 3.7%, and Houston-The Woodlands-Sugar Land again had the highest unemployment rate in this group at 4.2%. Of the 25 MSAs in Texas, 11 of them reported lower unemployment rates for January compared to the previous month, while the other 14 MSAs had unchanged unemployment rates compared to December. None of the MSA’s had an increase in their unemployment rate.
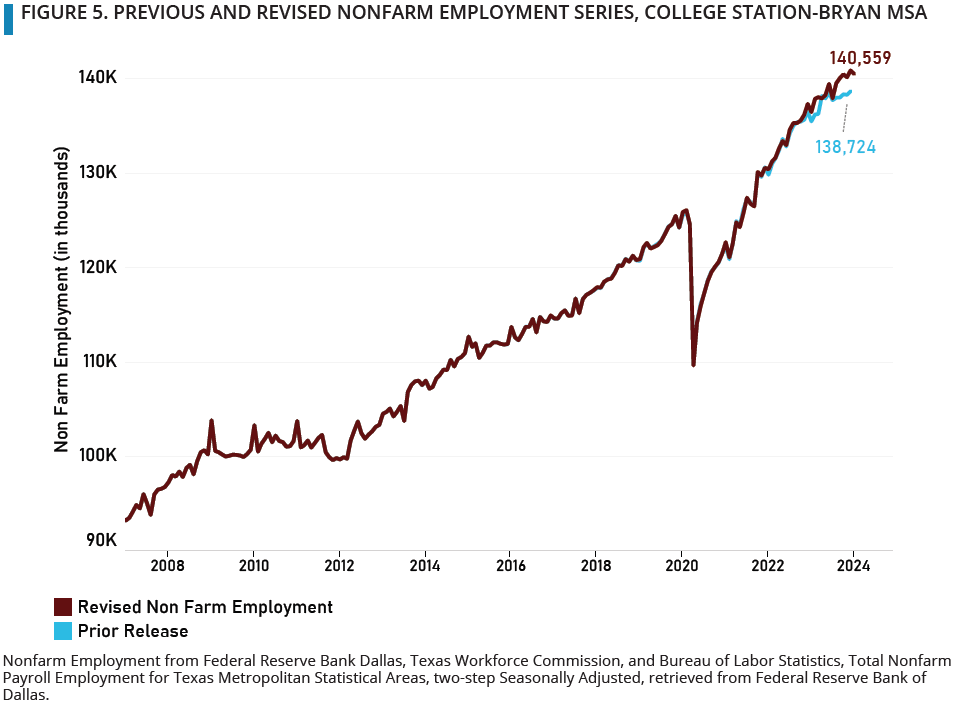
Revision of Non-Farm Employment
The Bureau of Labor Statistics (BLS) made changes to the nonfarm employment series for states and metropolitan statistical areas with their March data release. Figure 5 presents the previous release of the employment series along with the revised employment series. Prior to the revision, the local area’s nonfarm employment series showed a more subdued post-COVID rebound than is shown in the March revision. With the March release, the BLS revised upward its estimates of employment in months following the Covid-19 recession. For example, prior to the revision, the December 2023 estimate of College Station-Bryan nonfarm employment was 138,724 but that count was revised upwards to 140,921 in the revision. The employment count in January 2024 is now estimated to have been 140,559. The BLS notes that the large revision to its data is a by-product of annual benchmarking and updated seasonal adjustment factors. Each year, the nonfarm employment estimates from the Current Employment Survey are benchmarked to the census of employers and this, along with other methodological updates, produces the revised series.
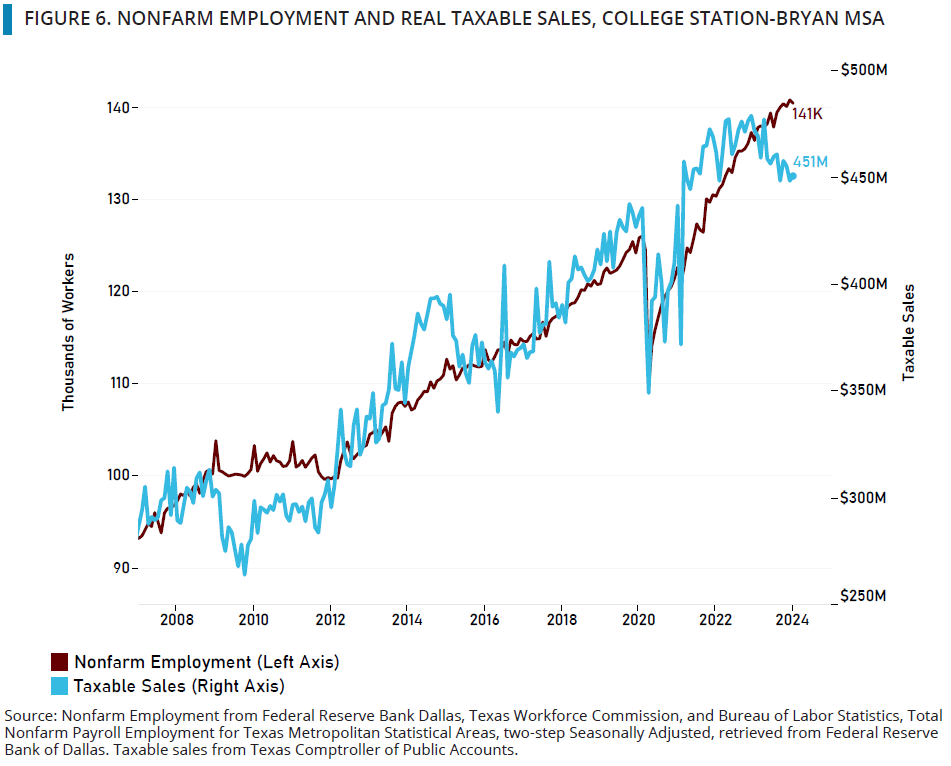
Non-Farm Employment and Real Taxable Sales, College Station-Bryan
Nonfarm employment and inflation-adjusted taxable sales in the College Station-Bryan MSA from January 2008 to January 2024 are depicted in Figure 6. As seen in the figure, these series have largely similar movements over time, although with periods of differences, and the greater volatility of the sales data is clear. The similar pattern of movements in these series is reflected in the Business-Cycle Index. After the Great Recession, both series experienced slow growth for a number of years, but from the beginning of 2012 to February 2020, nonfarm employment grew steadily, while the growth in taxable sales trended upward but was more volatile. As of January 2024, inflation-adjusted taxable sales were 3.4% higher than in the immediate pre-Covid recession month of February 2020, while nonfarm employment was 11.4% higher than in February 2020.
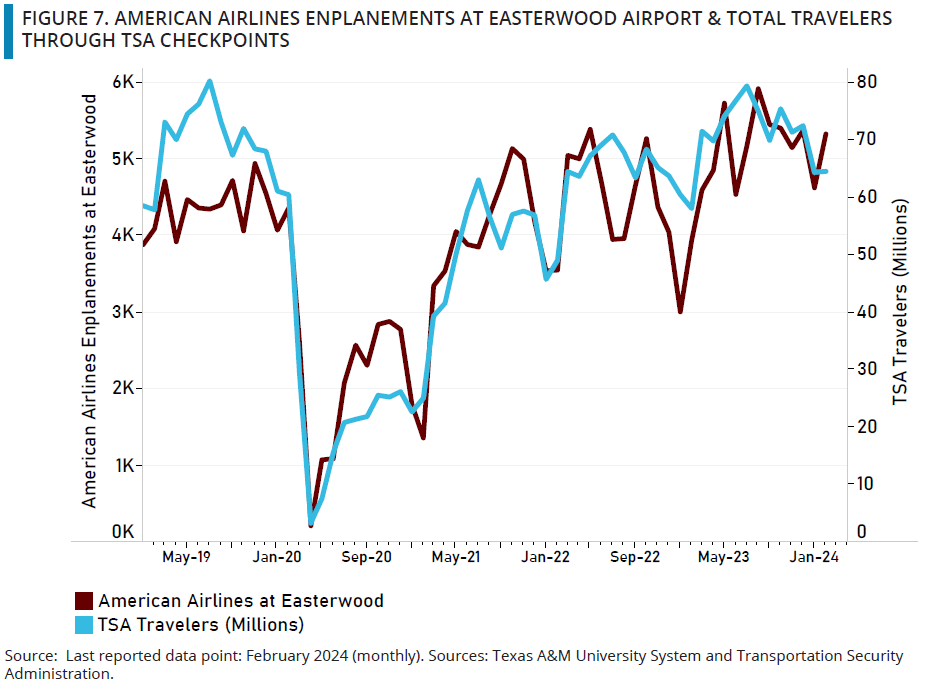
AIR TRAVEL
Figure 7 depicts the enplanements at Easterwood Airport on American Airlines (left axis) and the number of travelers nationwide passing through Transportation Security Administration (TSA) checkpoints (right axis) from January 2019 to February 2024. The national and local passenger counts have followed similar patterns from the beginning of 2019 to the present. National air travel was up 11% in February 2024 compared to February 2023. Locally, air travel out of Easterwood Airport on American Airlines during the twelve months from March 2023 to February 2024 was 16.5% higher than the during the twelve months from March 2022 to February 2023. Just comparing February 2024 to the preceding month, local and national air travel passenger counts were up by 15.2% and 0.2%, respectively.